
Scale-Up Is an Engineering Programme, Not a Size Change
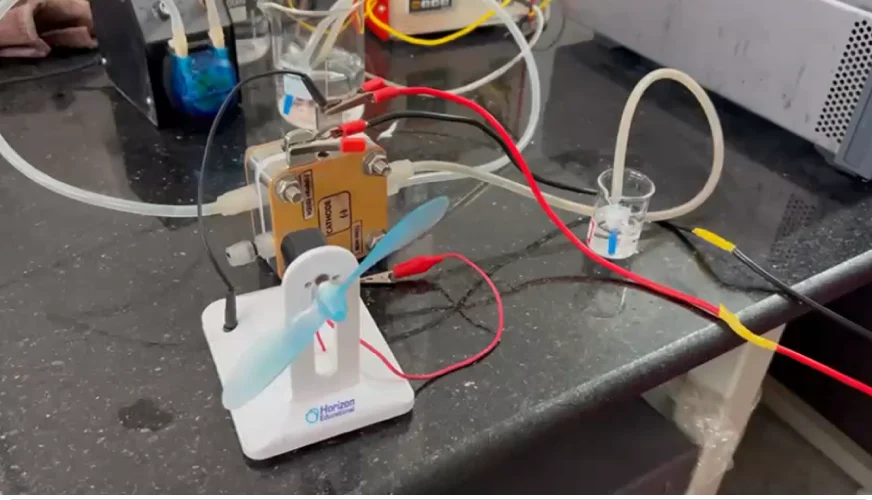
25 cm² experimental cell.
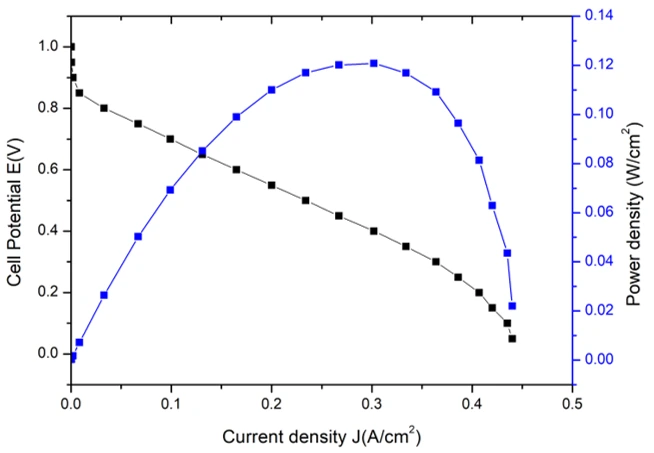
The MATLAB model starts from the measured cell.
Black dots are measured. The solid line is the MATLAB fit through them. The dashed lines show what happens if a larger cell keeps only part of that performance.
The model is not used outside the measured current range, and no temperature dependence or scale-up has been validated. Full model scope →
Each gate answers a different question.
Target Months are indicative from the start of the ₹5 crore programme and will be fixed with investors.
900 cm² is a design candidate.
At ideal retention of current experimental power density, a 900 cm² cell would scale to approximately:
Simulated — ideal reference
Important note
Actual large-cell performance is expected to depend on:
- flow distribution
- contact resistance
- membrane resistance
- thermal gradients
- current collection
- reactant utilisation
- pressure losses
| Performance retained | 900 cm² cell power | Cells for 10 kW gross |
|---|---|---|
| 100% · ideal reference | ~108.8 W | ~92 |
| 90% | ~97.9 W | ~103 |
| 80% | ~87.0 W | ~115 |
| 70% | ~76.2 W | ~132 |
| 60% | ~65.3 W | ~154 |
SIMULATED SENSITIVITY: not a final stack design. MATLAB power-density-retention case at the fixed peak-power current (~259 A). Retention below 100% is an unvalidated assumption. Cell counts are ideal gross sizing, all cells at peak power; they exclude balance-of-plant, DC/DC loss, cell mismatch, reserve and ageing.
What "10 kW" means
Target10 kW net vehicle power-system target: power delivered to the vehicle DC bus.
Gross stack output will be sized above 10 kW to account for balance-of-plant and conversion losses. In the MATLAB gross-to-net scenarios, delivering 10 kW net needs roughly 10.7–13.1 kW gross (central case ≈11.7 kW), so real cell counts will be higher than the table.
Simulated Scenarios combine a 5–15% balance-of-plant budget with 90–98% DC/DC efficiency.
The top technical risks, and the evidence that retires them.
| Risk | Mitigation | Current status | Next evidence |
|---|---|---|---|
| Large-area performance retention | Staged area scale-up: 100 → 400–600 → 900 cm² | Measured at 25 cm² only; larger areas modelled | 100 cm² polarisation vs 25 cm² baseline |
| NH₃ crossover / slip | Membrane and operating-window testing | Not yet quantified | Crossover and exhaust NH₃ measurement |
| High-current electrical losses | Cell-size and current-collection trade study | Modelled (contact-loss and bus-voltage trade studies) | Contact resistance measured on large-area hardware |
| Durability | Cycling and long-duration tests | No long-duration data yet | First extended-duration and start-stop test results |
| BoP parasitic load | Gross-to-net system modelling | Modelled: 5–15% budget scenarios | Measured BoP draw on the short stack |
| Vehicle safety | Containment, detection, isolation and independent testing | Concept architecture; no vehicle hardware tests | Enclosure leak, detection and shutdown response tests |
| Regulatory pathway | Early engagement with the relevant authorities | Reference frameworks identified | Documented approval pathway with PESO and testing agencies |
Investors receive the full risk register with monthly updates. A risk is closed only by evidence, not by a model.
Build. Measure. Stress. Learn. Repeat.
A failed test is information. A hidden failed test is risk.